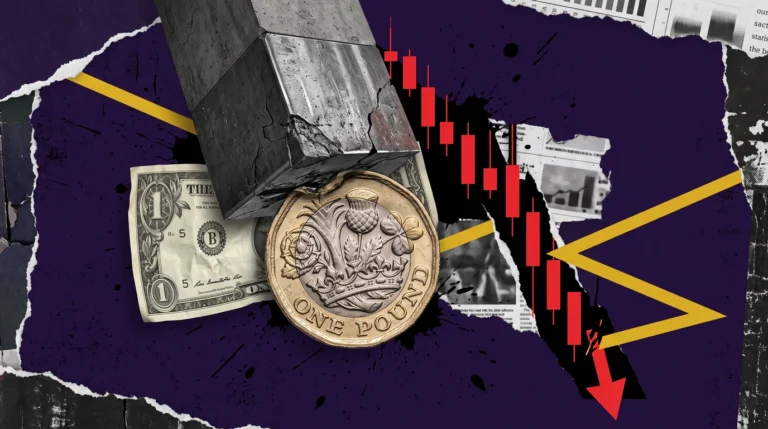

Retail traders saw US jobless claims drop to 208K and immediately went long on the US Dollar, crushing Gold to $3,982 and pushing USD/JPY to 162.40. They think the greenback is invincible. They are dead wrong. The reality? Retail sales just collapsed to a mere 0.2%, and the Dollar’s sudden spike is an engineered liquidity sweep, not a macroeconomic breakthrough. If you are chasing this move, you are the exit liquidity.
The 24-Hour Reality: A Fractured US Economy and the 100.80 Dollar Trap
To understand where the market is going, you have to look past the headline numbers and analyse the actual mechanics of the data. The US Dollar Index (DXY) has rallied toward 100.80, gaining roughly 0.3% on the surface. The narrative being sold to retail traders is simple: the US labour market is incredibly strong, so the Dollar must go up.
But look closer at the full picture. While Initial Jobless Claims fell to 208K—beating the 217K expectation—Retail Sales growth completely stalled, slowing to just 0.2% month-over-month from 1.0% previously. This is a massive divergence. The labour market is holding up, but the consumer is stopping their spending.
Institutions know that a consumer slowdown is the ultimate killer of economic growth. The push to 100.80 is not a genuine breakout; it is a liquidity hunt. Algorithms are using the strong jobless claims headline to push the Dollar into key resistance zones, triggering retail breakout buyers, so that smart money can offload their long positions at a premium.
Cross-Asset Dominoes: Why Gold is Bleeding at $3,982 and the Yen is Breaking
When the Dollar is artificially pushed higher, the ripple effects across other asset classes are violent and immediate.
- Gold (XAU/USD): The precious metal has dropped sharply toward $3,982, losing nearly 2%. Retail traders are panic-selling because the non-yielding asset looks less attractive when the Dollar spikes. But in reality, this is a classic sell-side liquidity sweep. Institutions are using the retail panic to accumulate physical metal at a discount before the consumer slowdown narrative takes over.
- USD/JPY: The pair has climbed toward 162.40. The stronger Dollar is keeping the Japanese Yen under heavy pressure. However, anyone buying this pair at 162.40 is ignoring the massive intervention risk. Japanese authorities are watching this exact level, and a sudden spike above 162.50 could trigger a violent, multi-hundred-pip reversal.
- AUD/USD & WTI Oil: The Australian Dollar has slipped below 0.7000 to 0.6995, driven by falling local inflation expectations and the strong US Dollar. Meanwhile, WTI Oil is falling toward $79.00 per barrel. Traders are taking profits despite ongoing Middle East supply risks, showing that the fear of a global consumer slowdown is currently outweighing geopolitical supply fears.
The Next 24 Hours: Where the Algorithmic Traps are Set
Institutional capital does not react to the past; it positions for the future. The remainder of the trading week contains high-impact events that will dictate the immediate narrative.
- Final Eurozone Inflation: Markets are waiting for the final numbers. Core HICP inflation is expected to remain at 2.4% year-over-year, while headline inflation is forecast at -0.1% month-over-month. This will drive immediate volatility in EUR/USD.
- US Housing & Industrial Data: US Housing Starts, Building Permits, and Industrial Production will be released. If these numbers show further consumer weakness, the Dollar’s 100.80 rally will quickly unwind.
- UoM Consumer Sentiment: The preliminary University of Michigan Consumer Sentiment Index will give us a direct read on how the average person is feeling about the economy. A drop here will confirm the retail sales collapse.
Execution Mechanics: Mapping the Institutional Footprints
Navigating a market driven by conflicting data requires mechanical execution. Here is how you trade the current environment without getting trapped.
For EUR/USD (Currently 1.1440): The pair is losing ground due to Dollar strength, but it is approaching a critical decision zone. Do not short the pair blindly at 1.1440. Wait for the Eurozone inflation data. If the data triggers a drop into the 1.1400 institutional order block, look for a 5-minute Market Structure Shift to go long. If it rejects the 1.1500 resistance, fade the move back down.
For USD/JPY (Currently 162.40): This is the most dangerous pair to trade right now. The risk of Bank of Japan intervention is extremely high. Do not buy breakouts above 162.50. Instead, map the liquidity pools above 162.60. If the price sweeps that high and immediately rejects, forming a bearish engulfing candle, that is your institutional entry to short the pair back toward 161.50.the range, targeting the opposite side of the consolidation.ht in The Legacy Method to place your limit order, ensuring your stop loss is protected behind the structural swing low.
Fatal Errors to Avoid Before the Weekend
Survival in the financial markets is about avoiding stupid mistakes. Keep these rules strict.
First, do not trade the US Housing Starts or Consumer Sentiment releases if you are using a funded evaluation account. Prop firms have strict rules against opening or closing trades within two minutes of high-impact news. Breaking this rule will void your account instantly.
Second, stop trying to guess the exact bottom of Gold at $3,982. Catching a falling knife is a retail habit. Wait for the price to actually form a structural base and break market structure to the upside before you commit your capital. Let the institutions show their hand first.
FAQ
Why is the US Dollar rising if retail sales are collapsing?
The Dollar is rising on the strong jobless claims data, which creates a short-term liquidity spike. However, the collapsing retail sales indicate underlying economic weakness, meaning this Dollar strength is likely a temporary trap rather than a long-term trend.
What is a liquidity sweep in Forex trading?
A liquidity sweep is when the price aggressively moves past a key support or resistance level to trigger retail stop-loss orders. Institutions use this engineered volume to fill their own massive orders before reversing the price in the original direction.
Why is Gold dropping to $3,982?
Gold is dropping because the short-term spike in the US Dollar makes it less attractive. However, this drop is largely an algorithmic move to clear out retail stop-losses, providing institutions with the liquidity they need to buy the metal at a discount.
How should I trade USD/JPY at 162.40?
Trading USD/JPY at these levels carries extreme intervention risk. Avoid buying breakouts. Instead, wait for a false breakout above 162.50 to trap retail buyers, then look for a market structure shift to enter a short position.
Stop guessing and start executing with institutional precision. The Traders Legacy™ mentorship is built for serious traders ready to master market mechanics, eliminate retail habits, and protect their capital. Step into the arena.
Want to start mapping structure immediately?
📒 Download the SMC Guide Sheets to get the exact visual frameworks for identifying institutional order blocks and liquidity sweeps on your charts today.
⚠️ Trading involves significant risk of loss. Past performance is not indicative of future results. This content is for educational purposes only and does not constitute financial advice.