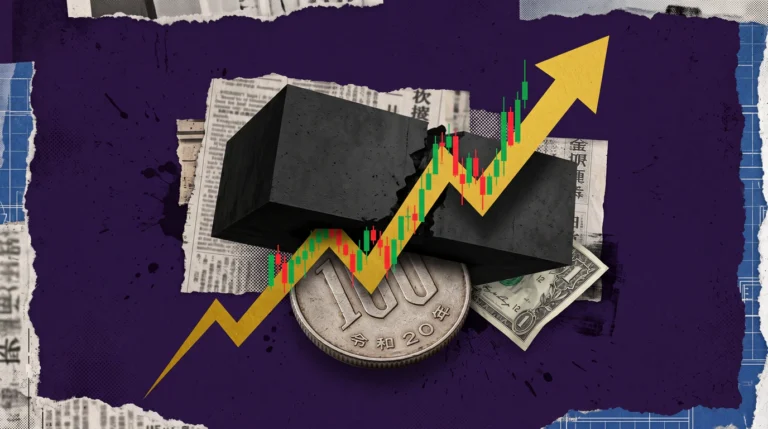

Retail traders are staring at the European Central Bank’s 2.25% rate pause and Gold’s aggressive push past $4,116, thinking it is just another standard technical breakout. They are completely blind to the geopolitical powder keg. While the masses trade lagging indicators and obsess over daily central bank press releases, an 11-day kinetic military conflict is actively choking the Strait of Hormuz and the Red Sea. The global supply chain is not just disrupted; it is being held hostage. If you are trading Forex pairs based solely on standard macroeconomic textbooks, you are bringing a calculator to a warzone. The market is no longer pricing in interest rates; it is pricing in the physical scarcity of hard assets and the deliberate fracturing of global trade.
The Brutal Reality
The Retail Narrative: “The ECB held rates at 2.25% and US jobless claims are resilient. I will buy the Euro and short the Dollar.”
The Institutional Reality: An 11-day military conflict has triggered a Houthi blockade in the Red Sea and pushed Brent crude to $90. The ECB is now trapped in a stagflation nightmare, and central banks are aggressively hoarding physical gold to bypass dollar sanctions.
The Fix: Stop trading the central bank headlines. Map the liquidity sweeps driven by geopolitical risk premiums, and align your execution with the institutional rotation into physical assets.
The Geopolitical Chokehold: Why the Dollar is Forging a Safe-Haven Crown
To understand the current volatility, you must analyse the mechanics of algorithmic price delivery against the backdrop of an active kinetic war. The US Dollar Index is trading near a one-week high, but this strength is not born from a booming domestic economy. It is a pure, unadulterated safe-haven bid.
For 11 consecutive nights, military airstrikes have targeted maritime facilities and drone storage, degrading commercial shipping routes. The resulting chokehold on global trade is absolute. Houthi rebels have officially announced a blockade on Saudi crude shipping, forcing tankers to reverse course in the Bab el-Mandeb Strait. This physical disruption has sent Brent crude spiking back toward $90 a barrel, as officials confirm that diplomatic mediation is currently stalled.
When global shipping lanes are blocked, energy prices spike. When energy prices spike, inflation re-anchors itself at the top of the central bank’s nightmare. This is why the US Dollar is commanding such a massive premium. Furthermore, the broader impact of administration trade wars, including a fresh 50% tariff slapped onto Canadian imports, is artificially suppressing the Dollar’s counterparts. Institutions are not buying the Dollar because they love the US economy; they are buying it because it is the only liquid lifeboat in a sinking global trade ship.
The ECB’s Stagflation Nightmare and the Flash PMI Trap
While the US Dollar rides the geopolitical risk premium, the Euro is walking into a macroeconomic trap. The European Central Bank leadership is widely expected to maintain its key deposit facility rate steady at 2.25%. Retail traders see a “pause” and assume the inflation fight is over. This is a fatal misreading of the tape.
The real catalyst for the Euro is not the rate decision; it is the Flash Purchasing Managers’ Index (PMI) data dropping immediately after. Eurozone manufacturing and services are hovering right on the edge of contractionary territory. If the reading falls below the critical 50.0 threshold, it confirms stagflation—rising input prices driven by the Middle East energy crisis, combined with collapsing economic growth.
The ECB is cornered. They cannot cut rates to save growth because war-driven energy inflation is still rampant. They cannot hike rates to fight inflation because the economy is already contracting. This paralysis is exactly what institutional algorithms exploit. They will use the ECB’s “pause” headline to engineer massive liquidity sweeps in EUR/USD, trapping retail breakout traders before driving the price into the true institutional order blocks.
The $4,116 Gold Reality and the $30,000 Repricing Debate
Spot Gold has experienced a violent 1.5% technical breakout, pushing past the $4,116 per ounce psychological threshold. Dip-buyers aggressively stepped in after bullion formed a brief technical floor near $4,000, using the yellow metal as a direct hedge against de-anchored global inflation expectations.
But the most fascinating development is not today’s price; it is the structural debate surrounding the $30,000 target. Mainstream banks have near-term targets at $4,800, but the $30,000 figure is dominating institutional chatter. It is crucial to understand what this number actually represents, as retail traders are wildly misinterpreting it.
The $30,000 target is not a prediction for next Tuesday. It represents two distinct structural realities:
- The Local Currency Repricing: In South Asian markets, wealth is tracked on a per-gram metric. Financial models project gold targeting ₹30,000 per gram by 2030, driven by the structural devaluation of paper currencies against physical bullion.
- The Hyperinflation / Fiat Collapse Model: Among macroeconomic analysts, a $30,000 USD per ounce target represents an absolute systemic collapse model. If Western central banks are forced to abandon inflation fights to rescue failing economic growth, unchecked money printing will cause hyperinflation. Furthermore, if the closure of global shipping channels causes a permanent fracturing of international trade, emerging economies will bypass the dollar. To anchor global trade using hard assets instead of paper fiat, the limited physical supply of bullion would require a massive repricing to the $25,000–$30,000 range to balance global liquidity.
This is why the People’s Bank of China and other emerging market central banks continue their structural accumulation of physical reserves. They are not trading; they are insulating themselves against a fiat currency reset. Paper gold is dying. Physical metal is the only truth left in the market.
Institutional Execution: Mapping the Minefield
Navigating a market torn between kinetic war, stagflation, and structural monetary shifts requires mechanical execution. You cannot trade the headlines; you must trade the footprints.
Navigating the Euro’s Stagflation Trap (EUR/USD) EUR/USD is losing ground amid renewed US Dollar strength, currently hovering near 1.1440. The market is waiting for the final Eurozone inflation report and the Flash PMIs.
- The Execution: Do not short the pair blindly just because the ECB is trapped. Wait for the PMI data to trigger a liquidity grab. If the data causes a drop into the 1.1400 institutional order block, look for a 5-minute Market Structure Shift to go long. If it rejects the 1.1500 resistance, fade the move back down. Let the algorithms clear the board before you enter.
Trading the Gold Accumulation Sweep (XAU/USD) Gold’s push to $4,116 is backed by sovereign buying, but the path is volatile.
- The Execution: Do not chase the breakout candle. Wait for a retracement into the 15-minute or 1-hour institutional order blocks created during the impulsive move past $4,100. Apply strict risk management, with a stop loss protected safely below the $4,000 psychological floor. If the price sweeps $4,000 and immediately reclaims it, that is your institutional entry signal.
The Yen’s Asymmetric Risk (USD/JPY) USD/JPY is rising toward 162.40, gaining around 0.1% as the stronger US Dollar keeps the Japanese Yen under pressure.
The Execution: The risk of intervention by Japanese authorities remains a massive overhang. Shorting this pair at multi-year highs is a high-risk retail trap. Algorithms will likely engineer a buy-side liquidity sweep above 162.50 to trap early shorts before any potential intervention-driven reversal. Wait for the sweep and a confirmed Market Structure Shift before considering a short position.
Fatal Errors in a Fractured Market
Survival in the financial markets is about avoiding catastrophic mistakes. When the data is this fractured, the margin for error is zero.
First, do not trade the ECB rate decision or the Flash PMI releases if you are using a funded evaluation account. Prop firms have strict rules against opening or closing trades within two minutes of high-impact news. Breaking this rule will void your account instantly, regardless of how accurate your directional bias was.
Second, stop trying to “front-run” the physical gold accumulation thesis by leveraging heavily on the daily chart. The shift toward a hard-asset global reserve system is a decade-long macroeconomic transition. Use Smart Money Concepts to trade the short-term volatility, but keep your long-term capital allocation disciplined and unhedged against short-term noise.
Third, never ignore the geopolitical risk premium. In a normal market, a strong US Dollar crushes Gold. In a war economy, both can rise simultaneously as capital flees fiat currency entirely. If you are trading based on 2019 correlations, you will be liquidated.
FAQ
Why is Gold breaking $4,116 despite a strong US Dollar?
In a standard macroeconomic environment, a strong Dollar pressures Gold. However, we are currently in a geopolitical crisis with an 11-day military conflict choking global shipping. Gold is breaking out because it is being used as a direct hedge against de-anchored global inflation and fiat currency risk, overriding the traditional inverse correlation.
What does the $30,000 gold target actually mean?
The $30,000 figure is not a short-term price prediction. It represents either a long-term per-gram target in local South Asian currencies (like INR/PKR) by 2030, or an extreme macroeconomic model predicting a total systemic fiat collapse. It reflects the mathematical reality that if global trade shifts to hard assets, the limited physical supply of gold requires a massive repricing to balance global liquidity.
How will the Flash PMI data impact the Euro?
The Flash PMI is the critical catalyst for the Euro. If the Eurozone manufacturing and services readings fall below the 50.0 threshold, it confirms stagflation (collapsing growth alongside high inflation). This would severely cap the Euro’s recovery and likely trigger a violent sell-off as institutions price in the ECB’s policy paralysis.
What is the risk of trading USD/JPY during a Middle East conflict?
Trading USD/JPY at multi-year highs during a geopolitical crisis carries extreme intervention risk. While the safe-haven US Dollar supports the pair, Japanese authorities are actively monitoring the 162.40 level. A sudden spike engineered by algorithms to trap retail buyers could trigger a massive, multi-hundred-pip intervention-driven reversal.
Stop guessing and start executing with institutional precision. The Traders Legacy™ mentorship is built for serious traders ready to master market mechanics, eliminate retail habits, and protect their capital. Step into the arena.
Want to start mapping structure immediately?
📒 Download the SMC Guide Sheets to get the exact visual frameworks for identifying institutional order blocks and liquidity sweeps on your charts today.
⚠️ Trading involves significant risk of loss. Past performance is not indicative of future results. This content is for educational purposes only and does not constitute financial advice.